2025 Grid Ridership Summary: Even Better than Projected

Two months ago, we published projections for our 2025 year-end ridership. So how did we do? How did the actual numbers stack up against our projections?
Projected Grid ridership:
164,106 rides
Actual Grid ridership:
164,215 rides
That’s a difference of just 109 rides—in the right direction. In other words, we did a little better than projected. Our total ridership from January through December 2025 was 164,215 rides, an increase of 14.4% compared to 2024.
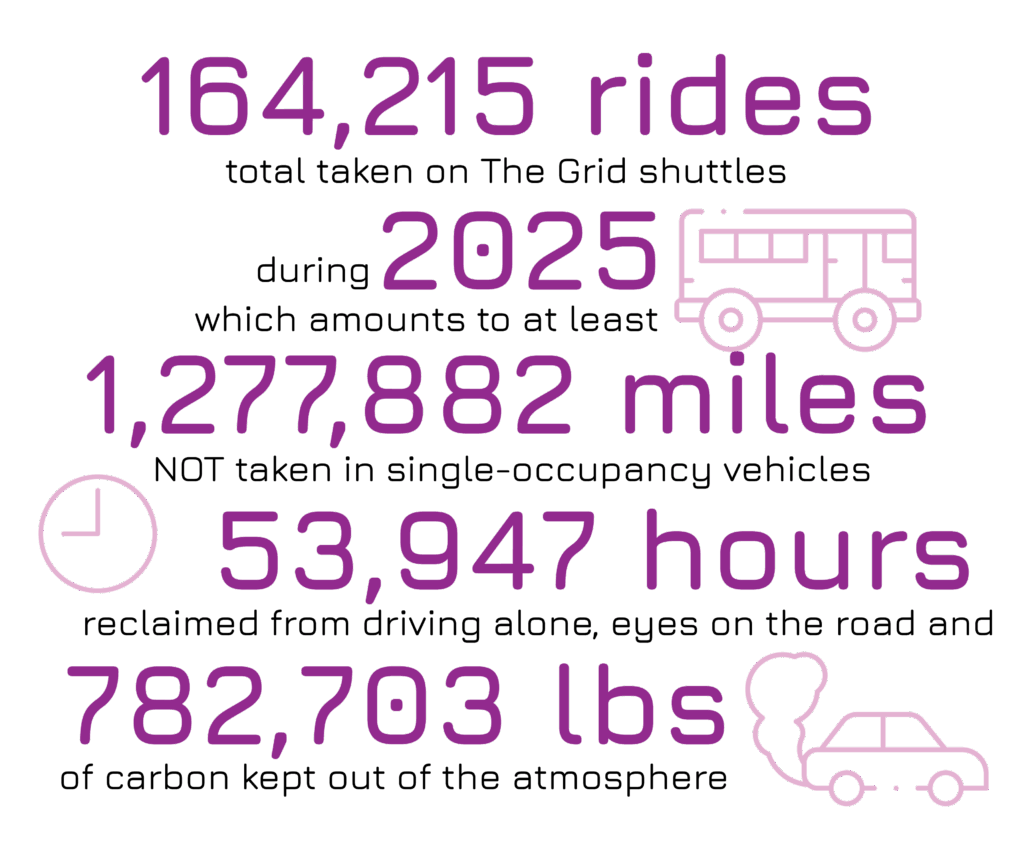
The infographic above puts that ridership in context. Those 164,215 rides translate to at least 1,277,882 miles not driven alone in single-occupancy vehicles. That’s also 53,947 hours riders didn’t spend behind the wheel. And it adds up to 782,703 pounds of carbon kept out of the atmosphere.
That’s real mode shift. More than a million car miles avoided. Tens of thousands of hours not spent driving. And about 355 metric tons of CO₂ kept out of the air.
It’s also important to treat these figures as estimated minimums. They reflect only the time riders spend on The Grid shuttles. They don’t include connecting trips by foot, bike, or MBTA.
We’re immensely proud of what our riders accomplished in 2025. This is what cooperative mobility looks like in practice: fewer solo car trips, more reliable commutes, and better everyday experiences.
It also reflects the kind of collaboration that makes our work possible. By aligning businesses, municipalities, and individuals, we’re creating transportation options that support a thriving, inclusive Route 128 West economy.