2024 Grid Ridership Summary: Mode Shift You Can Measure
2024 Ridership Impact Summary
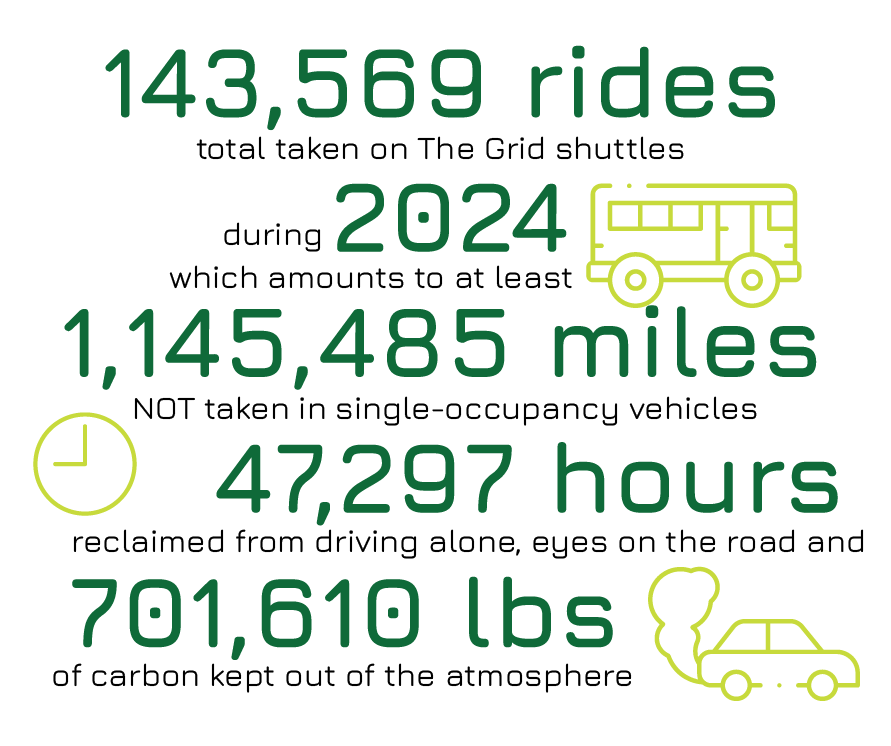
143,569 rides total taken on The Grid shuttle during 2024, which amounts to at least 1,145,485 miles not taken in single-occupancy vehicles; 47,297 hours reclaimed from driving alone, eyes on the road; and 701,610 lbs of carbon kept out of the atmosphere.
What the numbers mean: These rides represent meaningful mode shift. Over a million car miles avoided, tens of thousands of hours riders weren’t stuck driving, and more than 350 tons of CO₂ kept out of the air.
Plus, these figures should be understood as estimated minimums, since they reflect only the time riders spend on The Grid shuttles. They do not include the time spent on connecting modes like walking, biking, or using the MBTA.
A Deeper Dive on Ridership
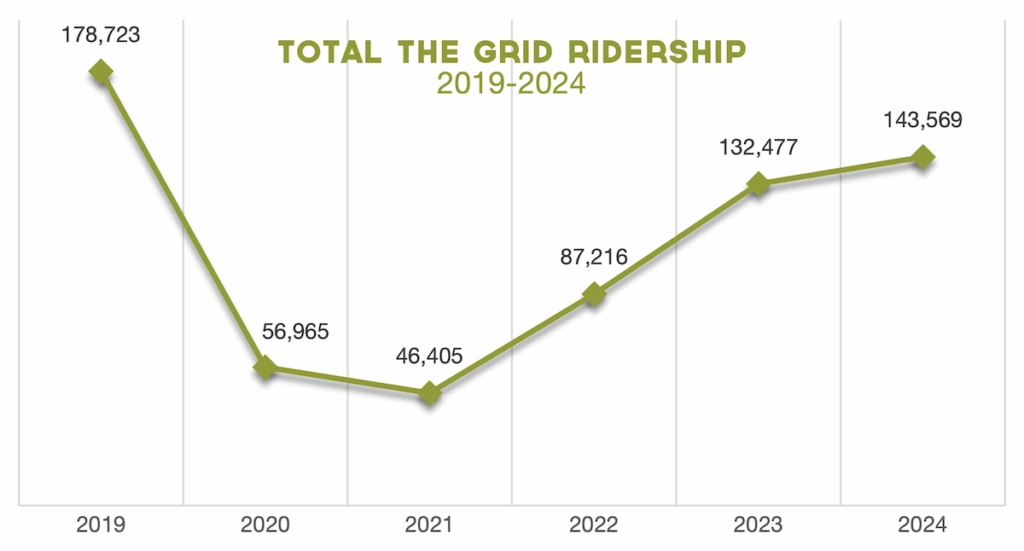
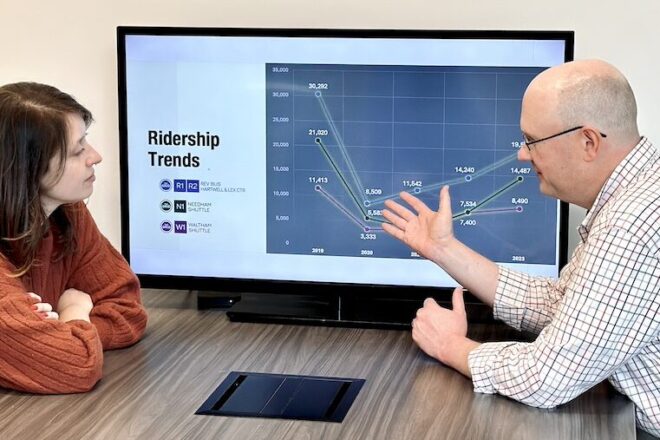
Total ridership across the entire Grid shuttle system was at an all-time high of 178,723 rides in 2019. During the pandemic, it fell to 56,965 rides in 2020, then down to a nadir of 46,405 rides in 2021. Since then, we’ve seen steady growth: 87,216 rides in 2022; 132,477 rides in 2023; and 143,569 rides in 2024.
Beyond the big picture of total ridership, another way to track how we’re rolling is by looking at riders per vehicle service hour (R/VSH). This metric measures how many passengers, on average, hop aboard each shuttle while it’s in service. Think of it as a way to gauge how efficiently we’re steering our resources to meet rider demand.
On the N1: Needham Shuttle, R/VSH was +37% higher in 2024 than 2019. On the W1: Waltham Shuttle, R/VSH was +15% higher in 2024 than 2019.
Even across the entire Alewife Shuttle System (A1, A2, A3, A5, A6), R/VSH was only 5% below 2019 levels. Translation? While overall ridership is at about 80% of pre-pandemic figures, we are meeting or exceeding resource efficiency on most routes by moving more passengers using fewer vehicle hours.
Note that the ridership total for 2019 shown above (178,723) does not include the three private (non-public) shuttle routes that ceased operation during the pandemic and which were not fully integrated into The Grid system.